A Gantt chart is a type of bar chart that shows the project schedule. This chart shows the tasks to be performed on the vertical axis and the time intervals on the horizontal axis. The width of the horizontal bars in the graph shows the duration of each activity. The Gantt charts show the start and end dates of the end elements and summary elements of the project. The end elements and summary elements form the structure of the project work breakdown. Modern Gantt charts also show the dependency (i.e. priority network) relationships between activities. Gantt charts can be used to show the current status of the plan by using percentage shading and a vertical „TODAY“ line.
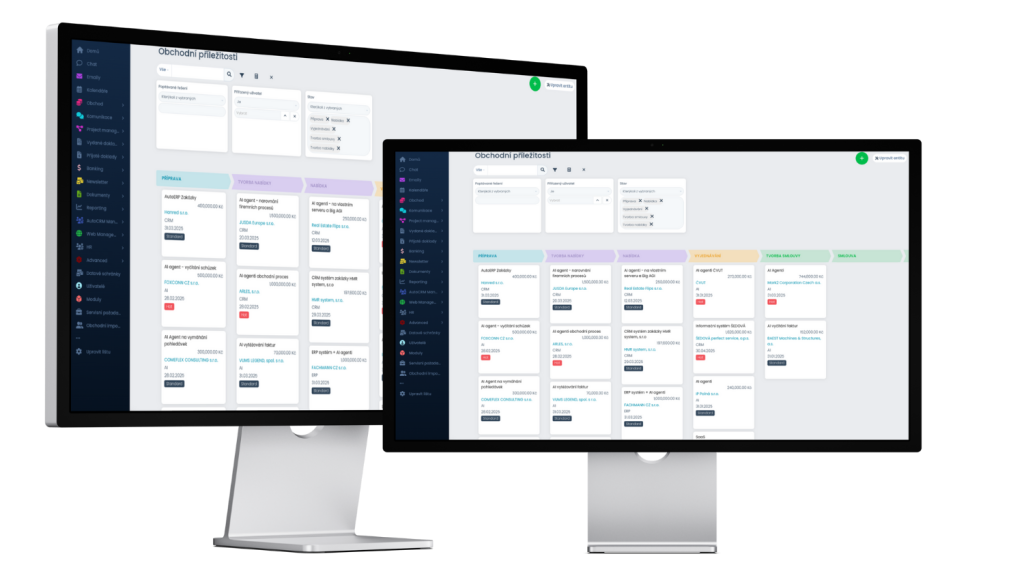
The Gantt chart is a great help in organizing work, that’s why it is part of our AutoCRM system, more information and examples can be found in the description of this function in CRM.
Understanding Gantt chart
The concept of gantt chart has become increasingly important in today’s business environment. As organizations strive for digital transformation, gantt chart offers valuable insights and practical solutions.
Key Benefits
• Enhanced operational efficiency through gantt chart implementation
• Improved decision-making capabilities
• Better resource allocation and cost optimization
• Increased competitive advantage in the marketplace
Implementation Strategies
Successful gantt chart adoption requires careful planning and execution. Organizations should consider their specific requirements, available resources, and long-term objectives when implementing gantt chart solutions.
Best Practices
To maximize the benefits of gantt chart, companies should focus on proper training, stakeholder engagement, and continuous improvement processes. Regular evaluation and optimization of gantt chart strategies ensure sustained success.
