The Gantt chart was invented by Henry Gantt, an American engineer and management consultant, who first used it in 1910 in his work for a railway company. His diagram was designed to show the project schedule and how the various tasks relate to each other. (His predecessor was Karol Adamiecki, who also worked on a similar system which he called „The Schedule“. Adamiecki was the first to realise how important it was to link planning and production.)
What is a Gantt chart and what does it look like?
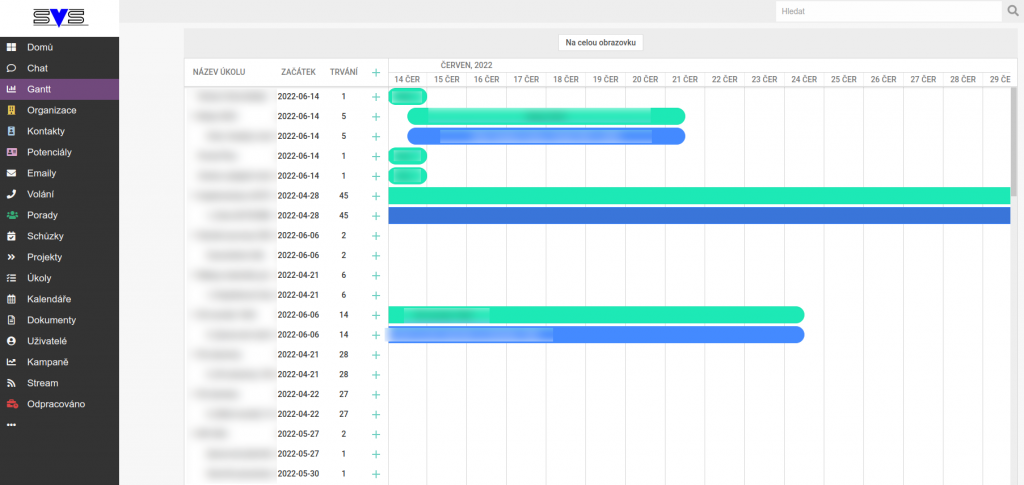
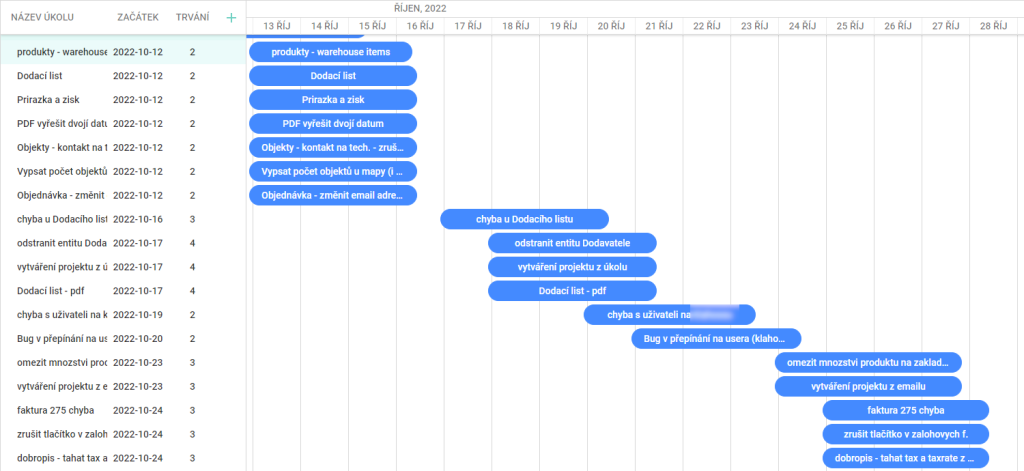
The basic principle of a Gantt chart is to show the work on a project on a timeline. On the left side of the chart is a list of activities and along the top is a convenient time scale. Each activity is represented by a bar, the position and length of the bar reflecting the start date, duration and end date of the activity. The columns can be interlinked (grey line).
Where it is used
Gantt charts are often used in project management, but also in other areas such as manufacturing or IT. You can focus on various applications of Gantt chart in product manufacturing, workforce distribution, transportation planning. It is also practically applicable in research and development. At AutoCRM we are open to our clients‘ ideas, we discuss everything in detail, evaluate the possibilities and suggest Gantt or other, better solutions.
Pros and cons
Gantt charts can be a very useful tool, but they can also have their limitations. The obvious advantage is the visual overview and the relative ease of understanding for everyone. The limitation lies mainly in the complexity of the project that should be represented by the diagram. If it is a very complex project with many interconnections and dependencies, Gantt can turn into chaos. But for most well thought out projects, the Gantt view will suffice amply. Another problem can be the price, if you have an already running system you want to implement Gantt in, it will usually not be cheap, the price is for a whole new system + implementation.
Alternatives to the Gantt chart
There are other tools that are used for project planning and management. Some can replace Gantt and others are a great complement to it. Often the choice between replacement or supplement depends on the type of project you need to manage.
Lists – such a better list of tasks with prioritization and assignment options.
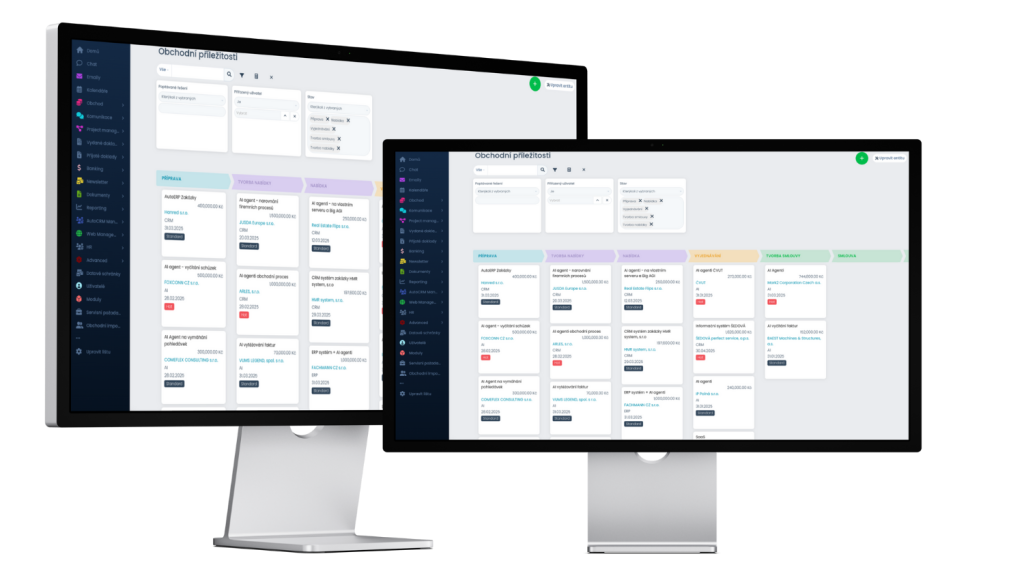
Kanban – a simple but well thought out board divided into thematic columns with headings.
Scrum – organizes projects chronologically by time periods. The format is very flexible and easy to customize.
Timeline – a very simple version of Gantt with one timeline and entries on it.
What can Gantt do in AutoCRM?
Like everything else, Gantt can be completely integrated with the basic CRM system and other modules. It is connected to project management and, of course, to tasks in projects. In AutoCRM you can see not only all projects at once in Gantt, but also for each individual project management your Gantt. Another advantage is the fact that the whole AutoCRM is connected to the chat, where you can of course also enter tasks for projects, so everything is automatically written into Gantt. You can even play with the settings. At the moment, for example, we have project management linked so that the moment we create a project, a channel is automatically created in chat. We then add exactly the employees who are working on the project to the chat channel. Complete linking allows employees to have more visibility and systematicity over their work.
Gantt itself is comprehensively linked to project management, so you can choose whether you control projects and tasks in project management or in gantt.


